Seeing History - Exploring the Amesbury Millyard with Maps
by John Mayer
Editor’s note: This essay has been written by John Mayer, executive director of the Amesbury Carriage Museum. John has a life-long interest in industrial history and has been part of the industrial survey team since he began his work for the museum.
Maps are powerful documents that tell us much about a particular period in history. Depending on why they were made, maps show the shape of buildings, roadways, property boundaries and natural features. And maps are made in various styles – some show buildings and some only landscape features. Generally, maps are made for a specific reason. Because of this, they express the interest and values of the person who made it.
This is a detail of a map published in 1880 showing the Amesbury millyard and surrounding town. This version of the map is in the collections of the Library of Congress in Washington, D.C.
Maps made by insurance companies provide useful details about how buildings were built or how they were used. These maps also show locations of fire hydrants or other parts of the urban infrastructure that helped insurance agents determine risks of fire so they could establish insurance rates. Beginning around 1885, the Sanborn Insurance Company published a new map approximately every five years. Comparing maps from different years show how the built environment has changed.
This 1910 view of the Hamilton Woolen Company shows the Amesbury millyard at the peak of development. This is called an isometric view and was published by the Associated Mutual Insurance Company of Boston. This map is in a private collection in Amesbury.
Around the time of a major sale, owners or buyers may survey their holdings to show property boundaries and important features on the landscape.
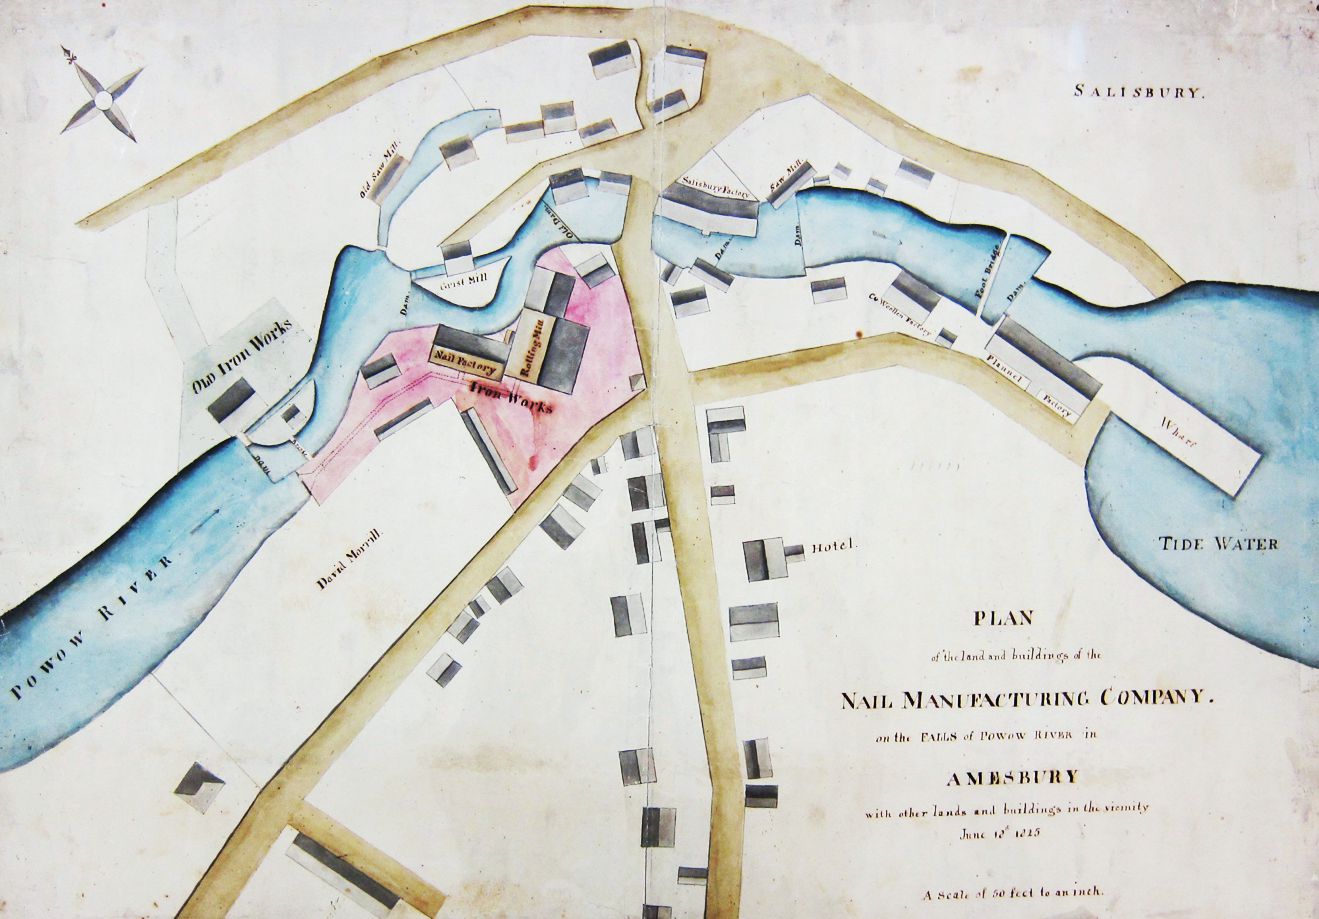
This is a plan view made in 1825 that shows the Powow River flowing through the area that became the Amesbury millyard. This map documents many incredible elements of Amesbury’s industrial past and was made around the time the Salisbury Manufacturing Company established their operations. Close examination shows six dams used for various water-powered mills, the location of the Jacob Perkins nail works (now partially occupied by the Newburyport Five Cents Savings Bank), and many small mills. The upper dam and a portion of the Counting House are the only features still standing today. This map is in the collections of the Peabody Essex Museum.
Our volunteer Mike Prendergast used the 1825 plan and developed an isometric view of the same area. Many of the buildings shown on the map had never been documented, so we made our best guess of their appearance. Others we had seen in various drawings or photographs and used those sources. In the truest sense, Mike created an artist’s view to show how the millyard probably looked in 1825.
An artist’s view of the millyard as it might have appeared in 1825. Volunteer Mike Prendergast created this map for the Amesbury Industrial Survey project.
Maps are powerful tools that help us understand and “see” Amesbury’s industrial history. These sources will continue to be part of the research and educational programs being developed by the Amesbury Carriage Museum.


